Antenna Element
[1]:
import numpy as np
import scipy.io

import neoradium as nr
[2]:
# Create an antenna element with a 65° beamwidth and a maximum attenuation of 30 dB.
el = nr.AntennaElement(beamWidth=[65,65], maxAttenuation=30)
[3]:
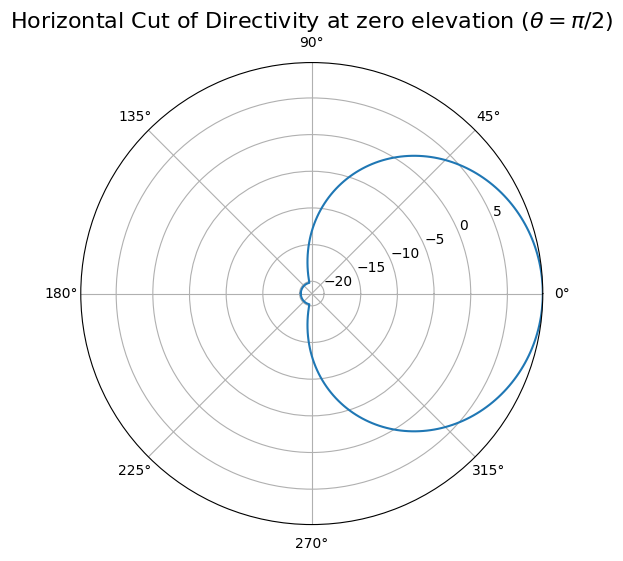
# Depending on the input parameters, the 'drawRadiation' method can generate different types of plots.
# Here, we plot the antenna element’s directivity in the horizontal plane at zero elevation.
radValues = el.drawRadiation(theta=90, viewAngles=(90,0), radiationType="Directivity", normalize=True)
[4]:
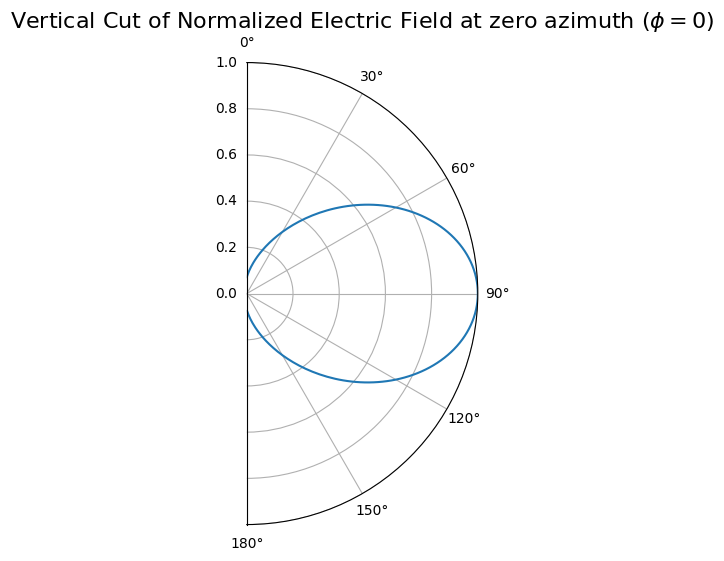
# Here, the 'drawRadiation' method is used to plot the field values in the vertical plane at an azimuth angle of 0°.
radValues = el.drawRadiation(phi=0, radiationType="Field", normalize=True)
[5]:
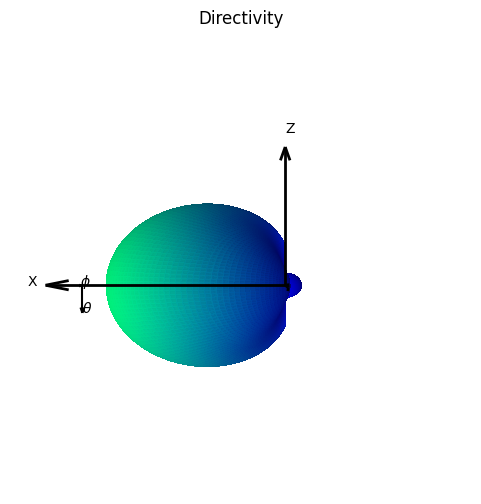
# Here, the 'drawRadiation' method is used to generate a 3D plot of directivity.
radValues = el.drawRadiation(radiationType="Directivity", normalize=True, viewAngles=(90,0))

[6]:
# Here, the 'drawRadiation' method is used again to generate a 3D plot of directivity.
# This time, however, we set the angular resolution to 2°, which makes the plot render faster
# but slightly coarser than before. (The default angular resolution is 1°.)
radValues = el.drawRadiation(theta=np.arange(0,180.1,2), phi=np.arange(-180,180.1,2),
                             radiationType="Directivity", normalize=True, viewAngles=(90,0))
[7]:
# Create an omnidirectional antenna element with θ(3 dB)=75°.
omni = nr.AntennaElement(beamWidth=[75,360])
radValues = omni.drawRadiation(radiationType="PowerDb", normalize=True, viewAngles=(40,20))

[ ]: