Antenna Array
[1]:
import numpy as np
import time

import neoradium as nr
[2]:
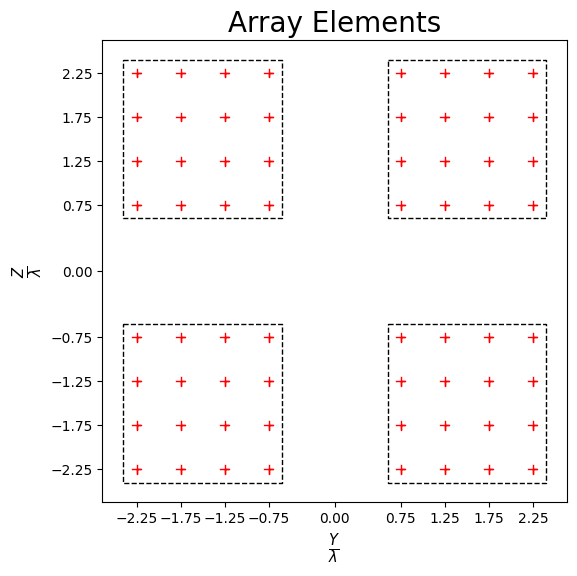
# We first create an antenna element template. The 'AntennaPanel' class uses this template to
# create the panel’s elements.
elementTemplate = nr.AntennaElement(beamWidth=[65,65], maxAttenuation=30)

# Now we create an antenna panel template. The 'AntennaArray' class uses this template to create the
# panels of the antenna array.
panelTemplate = nr.AntennaPanel([4,4], elements=elementTemplate, polarization="+")

# Now we can create the antenna array using the panel template. Note that the spacing values are
# multiples of the wavelength
antennaArray = nr.AntennaArray([2,2], spacing=[3,3], panels=panelTemplate)

# The 'showElements' method draws the antenna array, showing all panels and elements.
antennaArray.showElements(zeroTicks=True)
[3]:
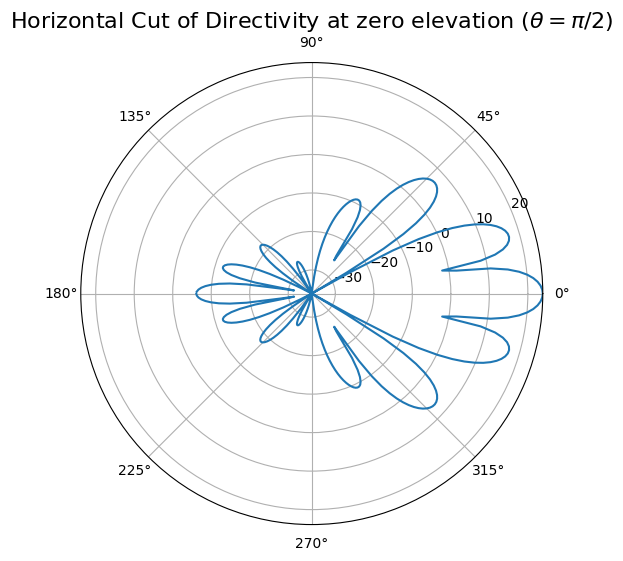
# Depending on the input parameters, the drawRadiation method can generate different types of plots.
# Here, we plot the antenna’s directivity in the horizontal plane at zero elevation.
radValues = antennaArray.drawRadiation(theta=90, radiationType="Directivity", normalize=False)
[4]:
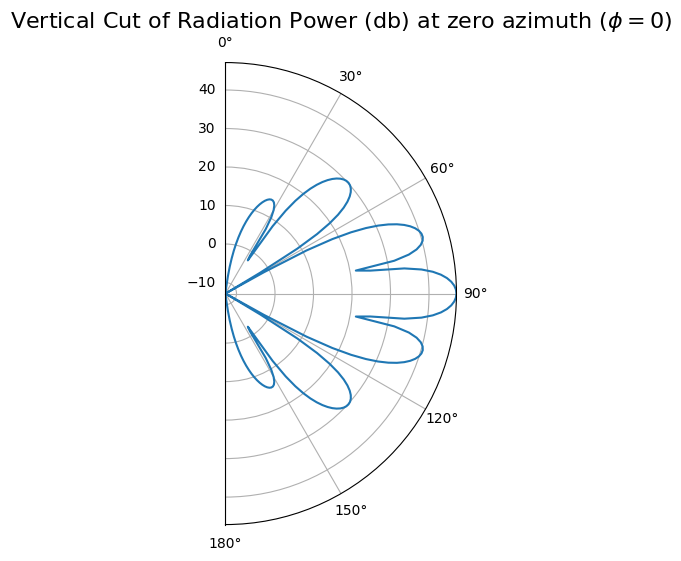
# Here, the 'drawRadiation' method is used to plot the radiation power in the vertical plane at an azimuth angle of 0°.
radValues = antennaArray.drawRadiation(phi=0, radiationType="PowerDb", normalize=False)
[5]:
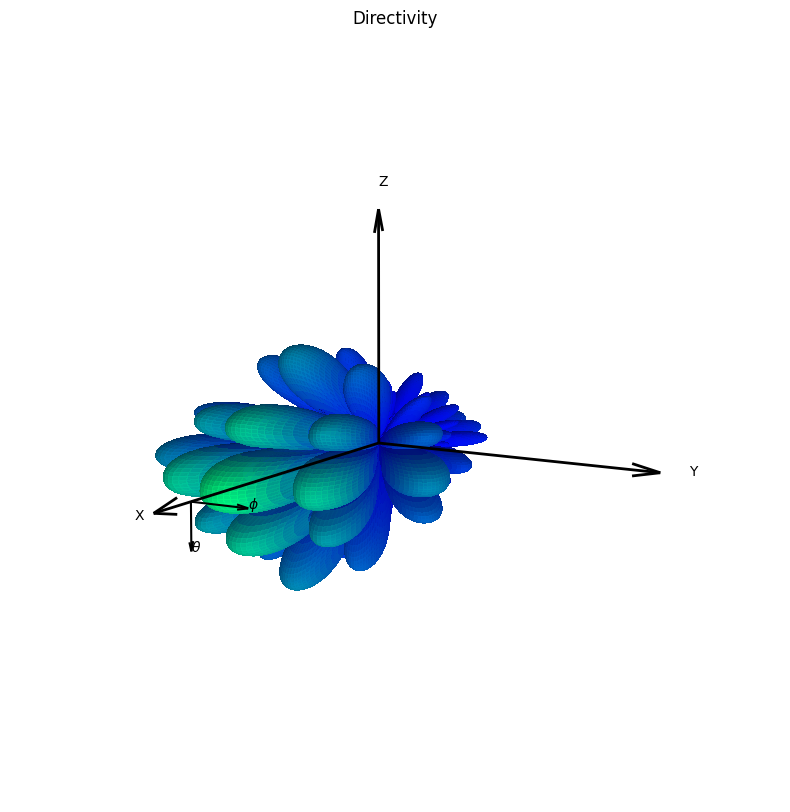
# Here, the 'drawRadiation' method is used to generate a 3D plot of directivity.
radValues = antennaArray.drawRadiation(radiationType="Directivity", normalize=True,
                                       viewAngles=(30,10), figSize=10)
[ ]: