DeepMIMO and UE Trajectories
This module introduces the DeepMimoData class, which encapsulates data related to
various scenarios in the DeepMIMO framework. The
getRandomTrajectory() method within this class facilitates the generation of
a random trajectory within the specified DeepMIMO scenario. Additionally, the
interactiveTrajPoints() method enables you to define your own trajectory on
an interactive map. A complete example of using the DeepMimoData class is available at
Working with DeepMIMO Scenarios in the playground.
- class neoradium.deepmimo.DeepMimoData(scenario, baseStationId=1, gridId=0)
This class encapsulates all the ray-tracing data read from DeepMIMO scenario files. It can be used to create random trajectories of user (UE) movements by interpolating the ray-tracing information at intermediate points on the trajectory.
The generated trajectories can then be used by the
TrjChannelclass to generate temporally and spatially consistent sequences of MIMO channels.- Parameters:
scenario (str) –
The name of the DeepMIMO scenario, which is also the name of the folder containing the scenario files.
baseStationId (int or str) –
The base station identifier. In the newer versions of DeepMIMO scenario files, the base station identifier is a text string. You can use the
showScenarioInfo()class method to print information about available base stations and correspondingbaseStationIdvalues. The default value is 1. In case of string base station identifiers, this default value results in selecting the first base station (after sorting the base station identifiers).gridId (int or str) –
For the scenarios with multiple user grids, this parameter determines which user grid data should be loaded. The default value is 0 which results in loading the first user grid. In the newer versions of DeepMIMO scenario files, the base station identifier is a text string. You can use the
showScenarioInfo()class method to print information about available user grids and their corresponding identifiers. In case of string grid identifiers, this default value of 0 results in selecting the first user grid (after sorting the user grid identifiers).
Other Properties:
After reading the DeepMIMO scenario files, this class sets internal properties as follows:
- gridSize:
A NumPy array of 2 integers indicating the number of grid points in
xandydirections.- numGridPoints:
The total number of grid points with ray-tracing data in the specified scenario. Note that \(numGridPoints = gridSize[0] * gridSize[1]\).
- delta:
The distance between 2 neighboring grid points (in
xorydirection). It is assumed that this value is the same along theXandYaxes.- bsXyz:
A NumPy array containing the three dimensional coordinates of the base station.
- xyMin, xyMax:
NumPy arrays containing the coordinates of lower left and upper right points on the grid. In other words, for the \((x,y)\) coordinates of any grid point, we have:
\[ \begin{align}\begin{aligned}xyMin[0] \le x \le xyMax[0]\\xyMin[1] \le y \le xyMax[1]\end{aligned}\end{align} \]- carrierFreq:
The carrier frequency for the specified scenario.
- minPaths, avgPaths, maxPaths:
Measured statistics representing the minimum, average, and maximum number of paths between the UE and the base station for all grid points in the specified scenario.
- numTotalBlockage:
Total number of grid points with no paths between the UE and the base station.
- numLOS:
Total number of grid points where there is a Line-of-Sight (LOS) path between the UE and the base station.
Indexing:
This class supports direct indexing to the
TrjPointobjects in the DeepMIMO dataset. For example:deepMimoData = DeepMimoData("O1_3p5B", baseStationId=3) # Read and create dataset tenFirstPoints = deepMimoData[:10] # Getting the first 10 points in the dataset
Iterating through points:
This class has a generator function (
__iter__) which makes it easier to use it in a loop. For example, the following code counts the number of points with LOS paths.deepMimoData = DeepMimoData("O1_3p5B", baseStationId=3) # Read and create dataset numLosPoints = 0 for point in deepMimoData: # Use "deepMimoData" directly with the "for" loop if point.hasLos==1: numLosPoints += 1
- classmethod showScenarioInfo(scenario)
This class method prints information about the specified DeepMIMO scenario. It can be used to find out the base stations and user grids available in the scenario.
- Parameters:
scenario (str) – The name of DeepMIMO scenario, which is also the name of the folder containing the scenario files.
- print(indent=0, title='DeepMimoData Properties:', getStr=False)
Prints the properties of this class.
- Parameters:
indent (int) – Used internally to adjust the indentation of the printed info.
title (str) – The title used for the information. By default the text “DeepMimoData Properties:” is used.
getStr (boolean) – If this is True, the function returns a text string instead of printing the info. Otherwise when this is False (default) the function prints the information.
- Returns:
If “getStr” is true, this function returns a text string containing the information about the properties of this class. Otherwise, nothing is returned (default).
- Return type:
str or None
- classmethod setScenariosPath(newPath)
This class method establishes the path to a folder that contains the ray-tracing scenarios. Within this folder, each scenario is organized into its own sub-folder, with the same name as the scenario itself.
- Parameters:
newPath (str) – The new path to the ray-tracing scenario files.
- getRandomTrajectory(xyBounds, segLen, bwp, trajLen=None, trajTime=None, trajDist=None, xyStart=None, prob=None, trajDir='All', speedMps=None)
Creates and returns a random trajectory in the area specified by
xyBoundsinside the grid of points in the given scenario. This function first creates a random “On-Grid” trajectory of points. It then interpolates additional trajectory points between the grid points. See Working with DeepMIMO Scenarios for a complete example.- Parameters:
xyBounds (2-D list of integers) – A 2x2 matrix representing the bounds of the area where the random trajectory will be generated. The matrix should be in the format
[[minX, minY], [maxX, maxY]]. All points in the returned trajectory will be confined within these bounds. If the area defined byxyBoundsoverlaps with parts outside the grid area specified byxyMinandxyMax, the boundaries are internally adjusted to ensure that the trajectory falls within the intersection of the areas defined byxyBoundsand the pair (xyMin,xyMax).segLen (integer) – The number of grid points that the shortest segment of the trajectory traverses, excluding the starting point. For instance, if
segLenis set to 2, it implies that each segment of the generated trajectory passes through at least three grid points (including the starting point). This parameter can be utilized to control the frequency of turns in a trajectory. A largersegLenvalue results in a reduced number of turns in the trajectory.bwp (The bandwidth part used to decide the timing of the interpolated trajectory points. One interpolated) – trajectory point is created for each slot of communication.
trajTime (float or None) – If provided, it represents the total travel time (in seconds) along the trajectory. Note that the actual travel time on the generated trajectory may not be precisely equal to this value due to the approximations in the calculations.
trajDist (float or None) – If provided, it represents the total travel distance (in meters) along the trajectory. This parameter is ignored if
trajTimeis specified. Note that the actual travel distance on the generated trajectory may not be precisely equal to this value due to the approximations in the calculations.trajLen (integer or None) –
If provided, it represents the total number of grid points on the trajectory (excluding the starting point). This parameter is ignored if one of
trajTimeortrajDistis specified.Important
At least one of
trajTime,trajDist, ortrajLenmust be specified.xyStart (list, tuple, NumPy array, or None) – The 2-D coordinates of the the trajectory’s initial position. If this parameter is set to None (default), the trajectory’s starting point is automatically determined based on
trajDirandxyBounds. Otherwise, the given value is first checked against the trajectory bounds (xyBounds) and modified if needed to ensure that the starting point falls within the specified boundaries.prob (tuple or None) – If provided, it must be a tuple containing three probability values for turning right, going straight, and turning left. These three probability values must collectively sum up to 1. If not specified, all three probabilities are assumed to be equal: \(P_{right}=P_{straight}=P_{left}=\frac 1 3\)
trajDir (str) –
This value can be used to restrict the direction of movement along the trajectory. At each step, the moving direction is the angle between the velocity vector and the X-axis. There are eight possible directions, corresponding to angles: 0, 45, 90, 135, 180, 225, 270, and 315 degrees. This parameter provides a general direction to the trajectory. It can take one of the following values:
- All:
No restriction in direction of movement in the trajectory. This is the default value.
- +X:
This forces the trajectory to move along the X-axis in positive direction. The only movement directions allowed in the trajectory are 45, 0, and 315 degrees.
- -X:
This forces the trajectory to move along the X-axis in negative direction. The only movement directions allowed in the trajectory are 135, 180, and 225 degrees.
- +Y:
This forces the trajectory to move along the Y-axis in positive direction. The only movement directions allowed in the trajectory are 135, 90, and 45 degrees.
- -Y:
This forces the trajectory to move along the Y-axis in negative direction. The only movement directions allowed in the trajectory are 225, 270, and 315 degrees.
speedMps (float or None) – If provided, it specifies the trajectory speed in meters per second. If not provided, the speed is automatically determined based on the scenario type (indoor vs outdoor). The current implementation uses an average walking speed of 1.2 m/s for indoor scenarios and 14 m/s for outdoor scenarios (which corresponds to a car moving at 31.32 miles per hour). Note that the actual linear speed on the trajectory may not be precisely equal to this value due to the approximations in the calculations.
- Returns:
A
Trajectoryobject containing all the information about the created trajectory- Return type:
- drawMap(mapType='LOS-NLOS', overlay=None, figSize=6, ax=None)
This visualization function creates a map of the scenario, assigning different colors to the points on the grid.
- Parameters:
mapType (str) –
This specifies the type of map to be drawn by this function:
- LOS-NLOS:
The color used for each point depends on whether it has a Line-of-Sight path, or if there is a total blockage at that point.
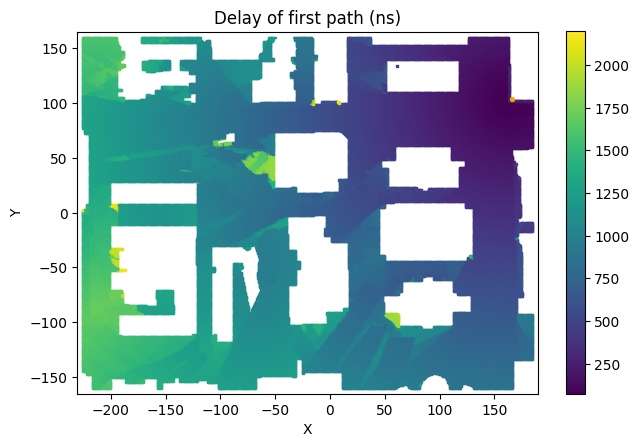
- 1stPathDelays:
The color used for each point depends the amount of delay for the strongest path at that point.
- 1stPathPowers:
The color used for each point depends the path power of the strongest path at that point.
overlay (
Trajectoryor NumPy array or None) – If this is aTrajectoryobject, then the trajectory will be drawn over the map. If this is a NumPy array, it must contain a list of indices of the points in the current scenario. In this case all the points in the list will be drawn (scatter plot) over the map.figSize (float) – This value determines the approximate size of the drawn map. If the maximum of the map’s width and height is less than the specified value, the map is scaled to match the specified size. The default value is set to
6.ax (matplotlib.axes.Axes or None) – If specified, it must be a matplotlib
Axisobject on which the Scenario Map is drawn. This can be used if you want to have a group of matplotlib subplots and draw the map in one of them.
Example:
deepMimoData = DeepMimoData("asu_campus1", baseStationId=1, gridId=0)
deepMimoData.drawMap("1stPathDelays")
- animateTrajectory(trajectory, numGraphs=0, graphCallback=None, mapType='LOS-NLOS', pointsPerFrame=10, fileName=None)
This visualization function generates a scenario map and animates the movement of a UE device along the specified trajectory within the map. Furthermore, it can animate up to three graphs below the scenario map. A complete example of using this function is available at Animating Trajectories in the playground.
- Parameters:
trajectory (
Trajectory) – The trajectory to animate. It must be an instance ofTrajectory.numGraphs (int) – The number of graphs drawn below the scenario map. The default is 0, which animates only the trajectory on the map.
graphCallback (function or None) – If
numGraphsis not zero, a callback function should be provided, which will be automatically called by this method. The function is initially called to configure the graphs, and then it is invoked for every frame of the animation to update or draw the graphs. For more information, please refer to the callback function section below.mapType (str) – This specifies the type of map that will be used as the background of the animation. For more information about the available values, please refer to the
drawMap()method.pointsPerFrame (int) –
This function creates a frame of animation every
pointsPerFrametrajectory points. The default is 10 which means create an animation frame every other 10 trajectory points. A value of 1, creates a frame for every trajectory point which takes 10 times more memory than the default value of 10.This function generates an animation frame every
pointsPerFrametrajectory points. By default, it creates an animation frame every other 10 trajectory points. If you set the value to 1, it creates a frame for every trajectory point, which requires 10 times more memory compared to the default value of 10.Note
For long trajectories, the animation can consume a significant amount of memory, and the matplotlib library may truncate it. To mitigate this issue, you can increase the value of
pointsPerFrameto reduce the memory required for the animation. Alternatively, you can configure the maximum memory usage for the animation by adding a line similar to the following somewhere near the beginning of your code:import matplotlib matplotlib.rcParams['animation.embed_limit'] = 100000000 # Set the limit to 100 MB
fileName (str or None) – If specified, it must be a path to a GIF file, and the animation will be saved to that file.
- Returns:
A
FuncAnimationobject containing the information about the animation. In a Jupyter Notebook, you can utilize theto_jshtml()method of theFuncAnimationclass to display the animation.- Return type:
Animation Callback Function
This function is automatically invoked to configure and display additional graphs below the scenario map during the animation. It accepts the following parameters:
- request:
This string can be either
"Config"or"Draw", indicating the purpose of the call.- ax:
This is an array of matplotlib.axes.Axes objects. Each element of this array is used to draw a graph below the animated scenario map.
- trajectory:
The
Trajectoryobject used for the animation.- points:
A tuple of two integer values, representing the indices of points in the trajectory for the previous and current frames, respectively. This parameter is utilized only when the
requestparameter is set to"Draw".
The following is an example of a callback function that draws two graphs below the animated trajectory on the scenario map.:
def handleGraph(request, ax, trajectory, points=None):
    if request=="Config":
        # Configure 1st graph for delay of first path
        ax[0].set_xlim(0,trajectory.numPoints)
        ax[0].set_ylim(900,1300)
        ax[0].set_title("Delay of first path (ns)")

        # Configure 2nd graph for Power of first path
        ax[1].set_xlim(0,trajectory.numPoints)
        ax[1].set_ylim(-130,-80)
        ax[1].set_title("Power of first path (dB)")

    elif request=="Draw":
        p0, p1 = points
        ax[0].plot([p0,p1], [trajectory.points[p0].delays[0], trajectory.points[p1].delays[0]], 'blue', markersize=1)
        ax[1].plot([p0,p1], [trajectory.points[p0].powers[0], trajectory.points[p1].powers[0]], 'red', markersize=1)
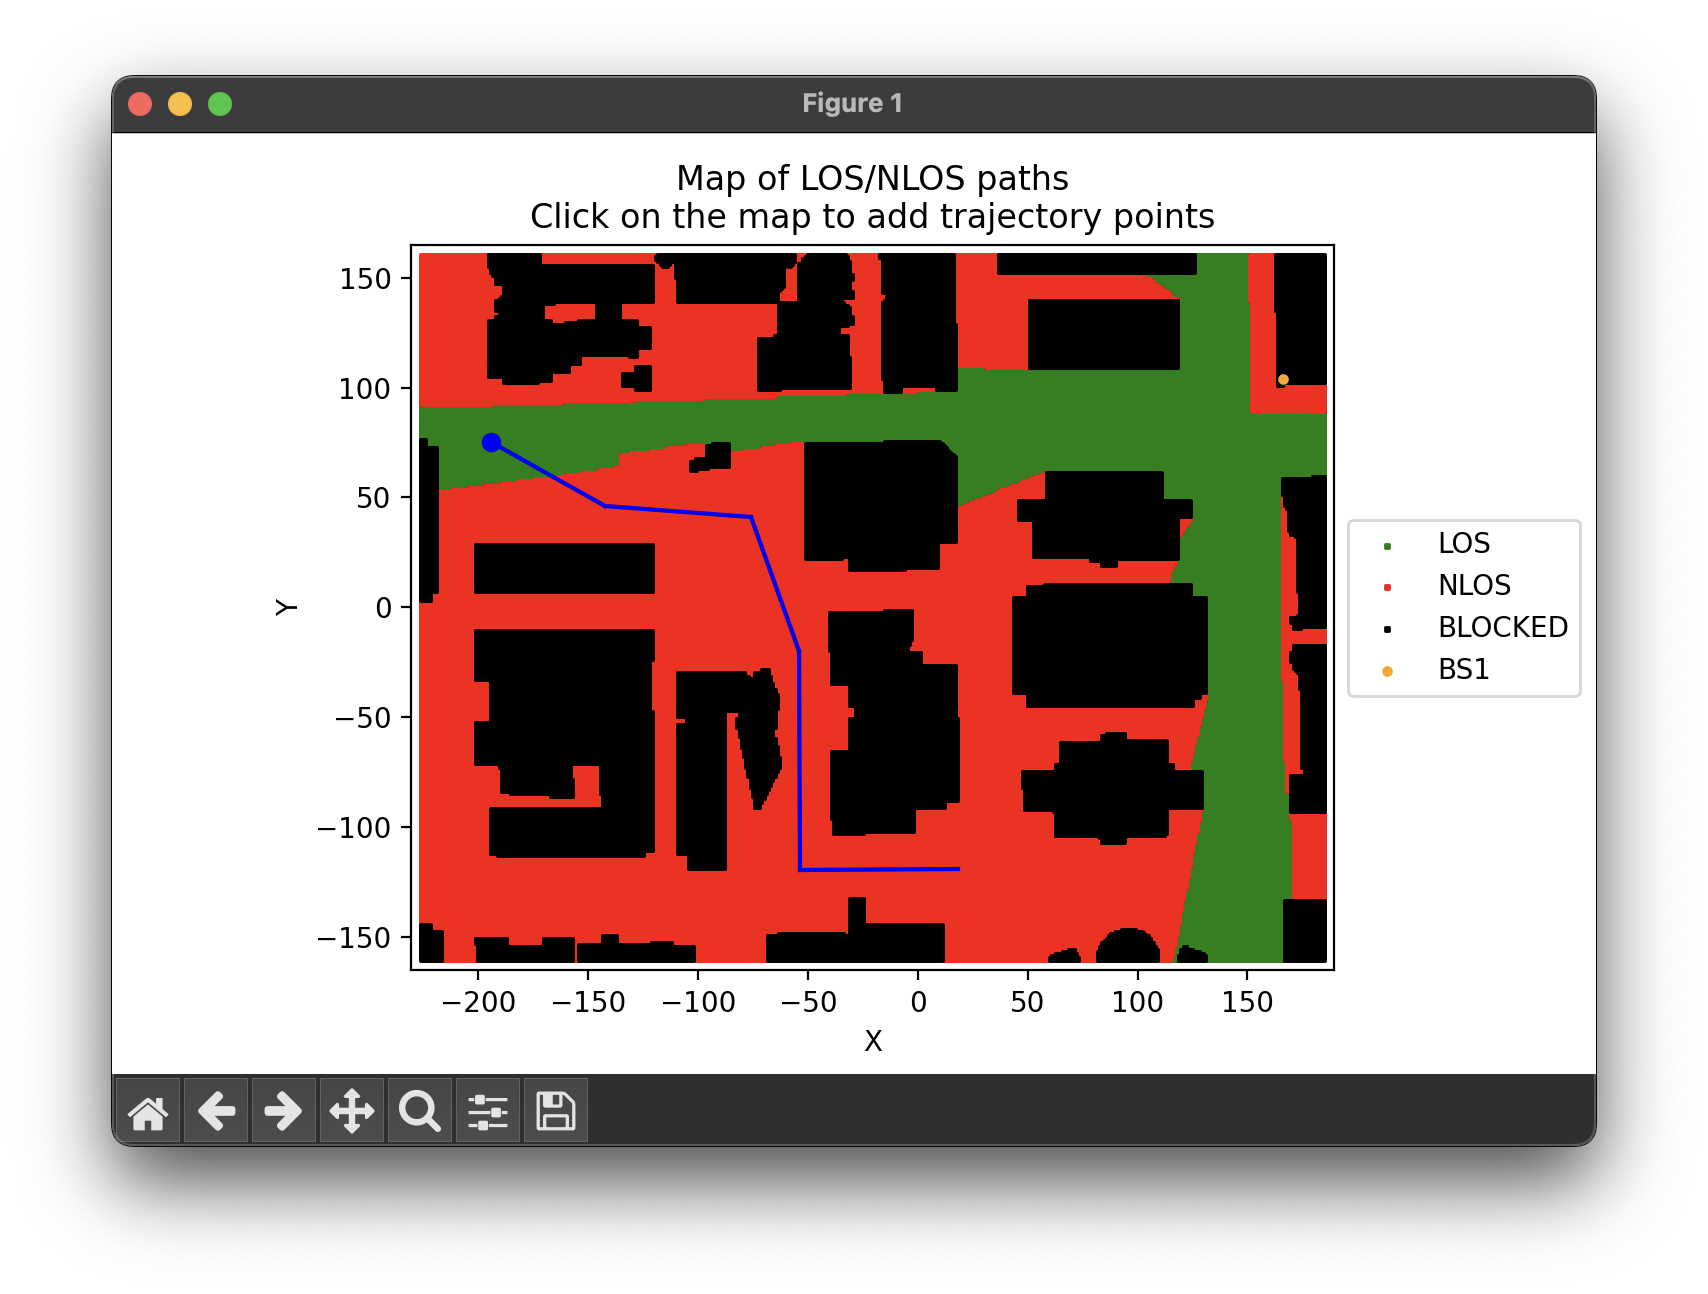
- interactiveTrajPoints(mapType='LOS-NLOS', backEnd='MacOSX', figSize=6)
This function enables you to create a trajectory by selecting points on the map. It opens a separate window displaying the scenario map. You can then click on the map points to create the trajectory. After each click, the map updates to show current trajectory. To end the trajectory, simply close the window. This function returns the selected points after closing the map window. The function
trajectoryFromPoints()can then be used to create aTrajectoryobject based on the captured trajectory points. The notebook file Working with DeepMIMO Scenarios contains an example of using this function.- Parameters:
mapType (str) –
This specifies the type of map to be drawn by this function:
- LOS-NLOS:
The color used for each point depends on whether it has a Line-of-Sight path, or if there is a total blockage at that point.
- 1stPathDelays:
The color used for each point depends the amount of delay for the strongest path at that point.
- 1stPathPowers:
The color used for each point depends the path power for the strongest path at that point.
backEnd (str) – The name of the interactive backend to be used by the matplotlib library. For more information, please refer to matplotlib backends. The default backend is “MacOSX”.
figSize (float) – This value determines the approximate size of the drawn map. If the maximum of the map’s width and height is less than the specified value, the map is scaled to match the specified size. The default value is set to
6.
- Returns:
An array of 2-D points on the current scenario map specifying the trajectory.
- Return type:
NumPy array
Example:
The code below can be utilized to generate a trajectory of points for the “asu_campus1” scenario. The image below illustrates the current trajectory, depicted by blue lines, and the starting point, marked by a small blue circle.
deepMimoData = DeepMimoData("asu_campus1", baseStationId=1, gridId=0)
points = deepMimoData.interactiveTrajPoints(mapType="LOS-NLOS")
- trajectoryFromPoints(points, bwp, speedMps=None)
Creates and returns a
Trajectoryobject based on the given trajectory points and parameters. Please refer to the notebook Working with DeepMIMO Scenarios for an example of using this function.- Parameters:
points (NumPy array) – This array of 2-D points on the current scenario map specifies the trajectory. The
interactiveTrajPoints()function can be used to obtain these points interactively.bwp (The bandwidth part used to determine the timing of the interpolated trajectory points. This implementation) – generates one interpolated trajectory point for each communication slot.
speedMps (float or None) – If provided, it specifies the trajectory speed in meters per second. If not provided, the speed is automatically determined based on the scenario type (indoor vs outdoor). The current implementation uses an average walking speed of 1.2 m/s for indoor scenarios and 14 m/s for outdoor scenarios (which corresponds to a car moving at 31.32 miles per hour). Note that the actual linear speed on the trajectory may not be precisely equal to this value due to the approximations in the calculations.
- Returns:
A
Trajectoryobject containing all the information about the created trajectory- Return type:
- getChanGen(numChannels, bwp, los=None, minDist=0, maxDist=inf, minX=-inf, minY=-inf, maxX=inf, maxY=inf, **kwargs)
Samples random points from the current scenario based on the specified criteria and returns a generator object that can generate channel matrices corresponding to those random points.
The indices of the random points can be retrieved using the
pointIdxproperty of the returned generator object. These point indices can then be passed to thedrawMap()method as an “overlay” to be displayed on the mapRefer to the notebook Creating random MIMO Channel Matrices from a DeepMimo Scenario for an example of using this method.
- Parameters:
numChannels (int) – This is the number of channel matrices generated by the returned generator which is equal to the number of points sampled from all the points on the grid of the current scenario. However, it disregards points with total blockage (i.e., points with no paths to the base station). If the given filter criteria result in insufficient points being available in the current scenario, the number of points sampled (and consequently, the number of channels generated) may be less than
numChannels.bwp (
BandwidthPart) – The bandwidth part object used by the returned generator to construct channel matrices.los (Boolean or None) –
It can be set to None, True, or False.
If set to None, the sampled points are not filtered based on their Line-of-Sight communication path (default).
If set to True, only the points with a Line-of-Sight communication path to the base station are considered.
If set to False, only the points without a Line-of-Sight communication path to the base station are considered.
minDist (float) – If specified, this parameter determines the minimum distance between the points and the base station. Points closer than this specified value will not be considered. The default is
0which effectively disables this filter.maxDist (float) – If specified, this parameter determines the maximum distance between the points and the base station. Points farther than this specified value will not be considered. By default, this parameter is set to
np.inf, which effectively disables this filter.minX (float) – If specified, parameter determines a lower bound for the
xcoordinate of the points to consider. It can be used with other filters to limit the points to a specific region. By default, this parameter is set to-np.inf, which effectively disables this filter.minY (float) – If specified, parameter determines a lower bound for the
ycoordinate of the points to consider. It can be used with other filters to limit the points to a specific region. By default, this parameter is set to-np.inf, which effectively disables this filter.maxX (float) – If specified, parameter determines an upper bound for the
xcoordinate of the points to consider. It can be used with other filters to limit the points to a specific region. By default, this parameter is set tonp.inf, which effectively disables this filter.maxY (float) – If specified, parameter determines an upper bound for the
ycoordinate of the points to consider. It can be used with other filters to limit the points to a specific region. By default, this parameter is set tonp.inf, which effectively disables this filter.kwargs (dict) –
Here is a list of additional optional parameters that can be used to further customize the calculation of the channel matrices:
- normalizeGains:
If the default value of True is used, the path gains are normalized.
- normalizeOutput:
If the default value of True is used, the gains are normalized based on the number of receive antenna.
- normalizeDelays:
If the default value of True is used, the delays are normalized as specified in “Step 3” of 3GPP TR 38.901 section 8.4. Otherwise, the original delays obtained from ray-tracing are used.
- filterLen:
The length of the channel filter. The default is 16 sample.
- delayQuantSize:
The size of the delay fraction quantization for the channel filter. The default is 64.
- stopBandAtten:
The stop-band attenuation value (in dB) used by the channel filter. The default is 80 dB.
- txAntenna:
The transmitter antenna, which is an instance of either the
neoradium.antenna.AntennaPanelorneoradium.antenna.AntennaArrayclass. By default, it is a single antenna in a 1x1 antenna panel with vertical polarization.- rxAntenna:
The receiver antenna which is an instance of either the
neoradium.antenna.AntennaPanelorneoradium.antenna.AntennaArrayclass. By default, it is a single antenna in a 1x1 antenna panel with vertical polarization.- txOrientation:
The orientation of transmitter antenna. This is a list of 3 angle values in degrees for the bearing angle \(\alpha\), downtilt angle \(\beta\), and slant angle \(\gamma\). The default is [0,0,0]. Please refer to 3GPP TR 38.901 Section 7.1.3 for more information.
- rxOrientation:
The orientation of receiver antenna. This is a list of 3 angle values in degrees for the bearing angle \(\alpha\), downtilt angle \(\beta\), and slant angle \(\gamma\). The default is [0,0,0]. Please refer to 3GPP TR 38.901 Section 7.1.3 for more information.
- xPolPower:
The cross-polarization power in dB. The default is 10 dB. It is defined as \(X=10 log_{10} \kappa^{RT}\) where \(\kappa^{RT}\) is the cross-polarization ratio (XPR). In the current implementation, this value is used for all paths.
- ueSpeed:
Specifies the speed of the UE. It can be one of the following:
If it is a tuple of the form
(speedMin, speedMax), at each point a random speed is sampled uniformly betweenspeedMinandspeedMax.If it is a list of the form [\(s_1\), \(s_2\), …, \(s_n\)], at each point a random speed is picked from those specified in the list.
If it is a single number, then the same UE speed is used at all points.
The default is
(0,20).- ueDir:
Specifies the direction of UE movement in the X-Y plane as an angle in degrees. It can be one of the following:
If it is a tuple of the form
(dirMin, dirMax), at each point a random angle is sampled uniformly betweendirMinanddirMax.If it is a list of the form [\(a_1\), \(a_2\), …, \(a_n\)], at each point a random angle is picked from those specified in the list.
If it is a single number, then the same UE direction is used at all points.
The default is
(0, 360).
- Return type:
ChanGen, a generator object that is used to generate channel matrices.
Example:
deepMimoData = DeepMimoData("asu_campus_3p5", baseStationId=1, gridId=0)
carrier = Carrier(startRb=0, numRbs=25, spacing=15) # Carrier with 25 PRBs, 15 kHz subcarrier spacing

# Create 100 channel matrices
chanGen = deepMimoData.getChanGen(100,
                                  carrier.curBwp,   # Bandwidth Part
                                  los=False,        # Include only Non-Line-of-Sight channels
                                  minDist=200,      # With distances to the base station between 200
                                  maxDist=250,      # and 250 meters
                                  maxX=100,         # With maximum x coordinate of 100 meters
                                  seed=123)         # Reproducible results
allChannels = np.stack([chan for chan in chanGen])  # Create the channel matrices
print(allChannels.shape)                            # Prints (100, 14, 300, 1, 1)