Channel timing
This notebooks shows the timing characteristics of a CDL channel model as it is applied to input signals for a duration of 100 slots.
[1]:
import numpy as np
import scipy.io
import time
import matplotlib.pyplot as plt

from neoradium import Carrier, Modem, CdlChannel, AntennaPanel, Grid, Waveform, random
from neoradium.utils import getNmse, getMse
[2]:
# Create a random grid and the corresponding TX waveform
carrierFreq=4e9 # 4 GHz

carrier = Carrier(startRb=0, numRbs=25, spacing=30) # Also try other subcarrier spacing values
bwp = carrier.curBwp
txGrid = bwp.createGrid(numPlanes=8)

stats = txGrid.getStats()
modem = Modem("16QAM")
numRandomBits = stats['UNASSIGNED']*modem.qm

bits = random.bits(numRandomBits)
symbols = modem.modulate(bits)

indexes = txGrid.getReIndexes("UNASSIGNED")
txGrid[indexes] = symbols

txWaveform = txGrid.ofdmModulate(carrierFreq)
print(bwp)
print("Shape of transmitted signal in time domain:",txWaveform.shape)
Bandwidth Part Properties:
  Resource Blocks:    25 RBs starting at 0 (300 subcarriers)
  Subcarrier Spacing: 30 kHz
  CP Type:            normal
  Bandwidth:          9 MHz
  symbolsPerSlot:     14
  slotsPerSubFrame:   2
  nFFT:               1024
  frameNo:            0
  slotNo:             0

Shape of transmitted signal in time domain: (8, 15360)
[3]:
# No Channel and no noise performance: ofdmModulate -> ofdmDemodulate
rxGridTD = txWaveform.ofdmDemodulate(bwp, f0=carrierFreq)
print(f"NMSE: {getNmse(txGrid.grid,rxGridTD.grid)}")
print(f"MAE: {np.abs(txGrid.grid-rxGridTD.grid).max()}")
NMSE: 4.082220685347875e-32
MAE: 8.082545620880531e-16
[4]:
# Create a CDL-D channel
channel = CdlChannel(bwp, 'D', delaySpread=300, carrierFreq=4e9, dopplerShift=15,
                     txAntenna = AntennaPanel([2,4], polarization="|"),  # 8 TX antenna
                     rxAntenna = AntennaPanel([1,2], polarization="|"),  # 2 RX antenna
                     seed = 1234)
channel
[4]:
CDL-D Channel Properties:
  carrierFreq:          4 GHz
  normalizeGains:       True
  normalizeOutput:      True
  txDir:                Downlink
  filterLen:            16 samples
  delayQuantSize:       64
  stopBandAtten:        80 dB
  dopplerShift:         15 Hz
  coherenceTime:        28.209 milliseconds
  delaySpread:          300 ns
  ueDirAZ:              0.0°, 90.0°
  Cross Pol. Power:     11 dB
  angleSpreads:         5° 8° 3° 3°
  TX Antenna:
    Total Elements:     8
    spacing:            0.5𝜆, 0.5𝜆
    shape:              2 rows x 4 columns
    polarization:       |
  RX Antenna:
    Total Elements:     2
    spacing:            0.5𝜆, 0.5𝜆
    shape:              1 rows x 2 columns
    polarization:       |
    Orientation (𝛼,𝛃,𝛄): 180° 0° 0°
  hasLOS:               True
  LOS Path:
    Delay (ns):         0.00000
    Power (dB):         -0.20000
    AOD (Deg):          0
    AOA (Deg):          -3
    ZOD (Deg):          1
    ZOA (Deg):          1
  NLOS Paths (13):
    Delays (ns):        0.000 10.50 183.6 408.9 421.5 541.2 778.8 532.5 1212. 2381. 2827. 2912.
                        3757.
    Powers (dB):        -13.5 -18.8 -21.0 -22.8 -17.9 -20.1 -21.9 -22.9 -27.8 -23.6 -24.8 -30.0
                        -27.7
    AODs (Deg):         0    89   89   89   13   13   13   35   -64  -33  53   -132
                        77
    AOAs (Deg):         -180 89   89   89   163  163  163  -137 74   128  -120 -9
                        -84
    ZODs (Deg):         98   86   86   86   98   98   98   98   88   91   104  80
                        86
    ZOAs (Deg):         82   87   87   87   79   79   79   78   74   78   87   71
                        73
[5]:
# Apply the channel in time domain:
maxDelay = channel.getMaxDelay()
paddedTxWaveform = txWaveform.pad(maxDelay)              # Pad the waveform with zeros
rxWaveform = channel.applyToSignal(paddedTxWaveform)     # Apply the channel to the waveform

syncedWaveform = rxWaveform.sync(channel.chanOffset)                 # Synchronization
rxGridTd = syncedWaveform.ofdmDemodulate(bwp, f0=carrierFreq)

# Apply the channel in frequency domain and compare
chanMat = channel.getChannelMatrix()
rxGridFd = txGrid.applyChannel(chanMat)
print(f"NMSE: {getNmse(rxGridFd.grid,rxGridTd.grid)}")
NMSE: 7.88512587715999e-06
[6]:
# Apply the channel to 100 slots of input signal
chanMats = []
for s in range(100):
    # Go to next slot and do it again:
    channel.goNext()

    txGrid = bwp.createGrid(numPlanes=8)

    stats = txGrid.getStats()
    numRandomBits = stats['UNASSIGNED']*modem.qm

    bits = random.bits(numRandomBits)
    symbols = modem.modulate(bits)

    indexes = txGrid.getReIndexes("UNASSIGNED")
    txGrid[indexes] = symbols

    txWaveform = txGrid.ofdmModulate(carrierFreq)

    # Apply the channel in time domain:
    maxDelay = channel.getMaxDelay()
    paddedTxWaveform = txWaveform.pad(maxDelay)              # Pad the waveform with zeros
    rxWaveform = channel.applyToSignal(paddedTxWaveform)     # Apply the channel to the waveform

    syncedWaveform = rxWaveform.sync(channel.chanOffset)                 # Synchronization
    rxGridTd = syncedWaveform.ofdmDemodulate(bwp, f0=carrierFreq)

    # Apply the channel in frequency domain and compare
    chanMat = channel.getChannelMatrix()
    rxGridFd = txGrid.applyChannel(chanMat)
    assert getNmse(rxGridFd.grid,rxGridTd.grid)<1e-3
    chanMats += [chanMat]
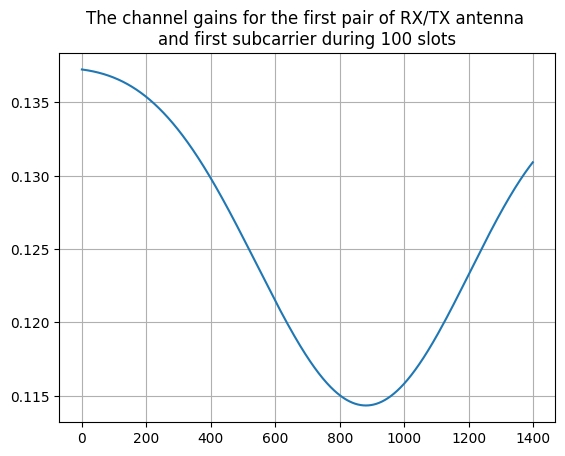
[7]:
gs = np.concatenate([chanMat[:,0,0,0] for chanMat in chanMats])
plt.plot(np.abs(gs))
plt.title("The channel gains for the first pair of RX/TX antenna \n"+
          "and first subcarrier during 100 slots")
plt.grid()
[ ]: